Why we opt for Incineration Technology ?
The Reality
Nowadays, the global market presents numerous technologies for recovering energy from waste, so why do we opt for incineration? Alternative technologies such as pyrolysis, gasification, or plasma treatment are also widely recognized.
In our everyday activities, we face various prevalent misconceptions regarding incineration. These misconceptions result in a complete misunderstanding of the prominence and functions of contemporary waste-to-energy technologies. That is the reason we believe it is necessary to provide commentary on the existing technology.
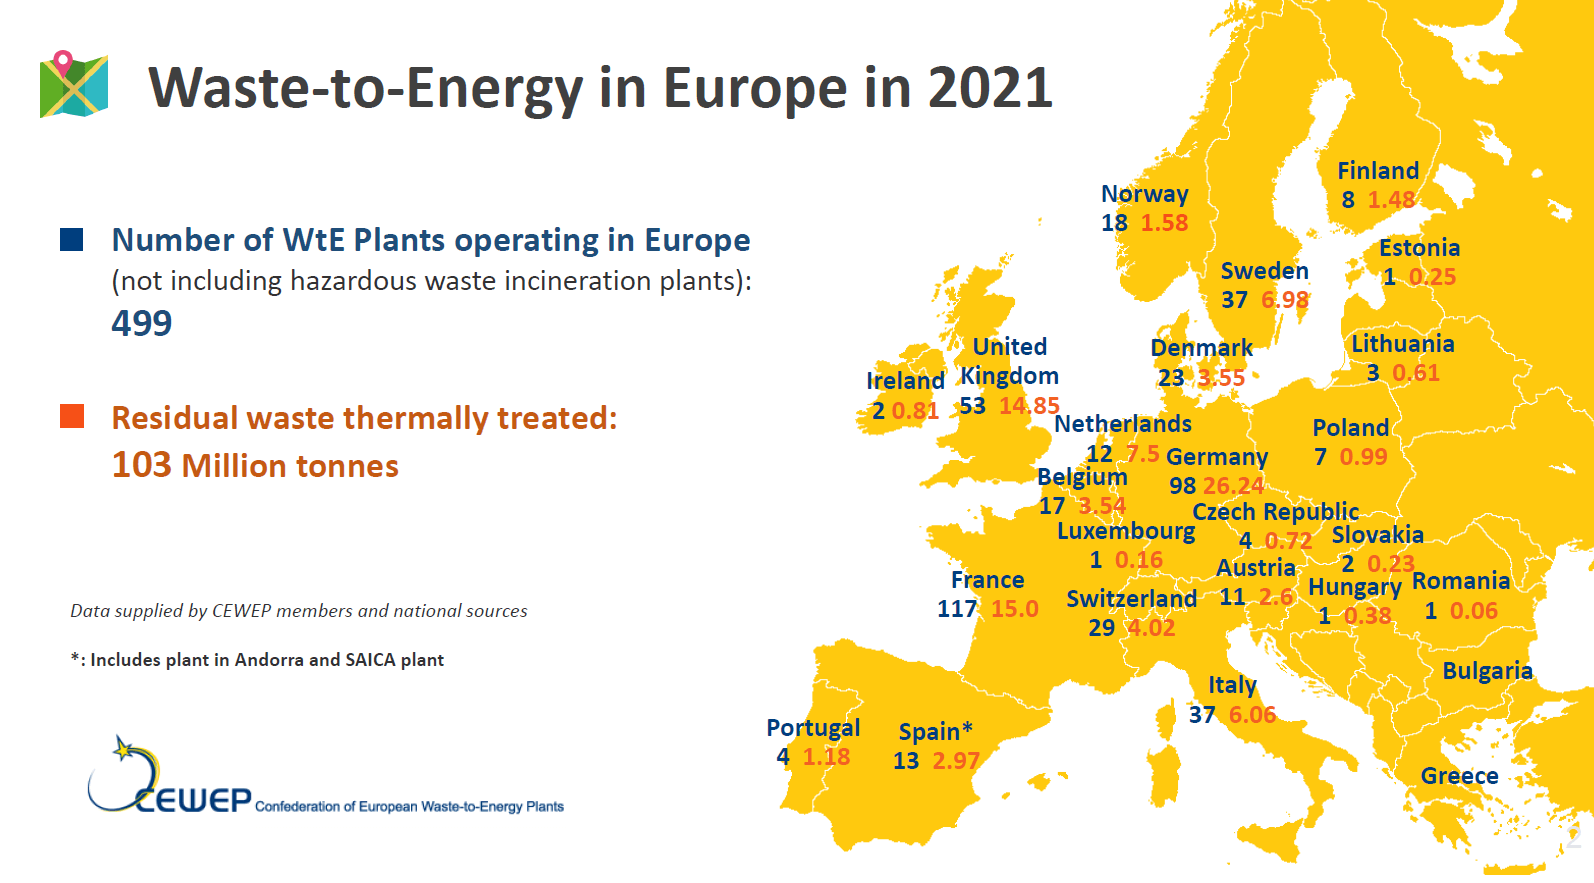
The map below illustrates the number of waste-to-energy plants in Europe alone (blue numbers) along with the amount of waste in million tons being incinerated annually (red numbers).
Waste to Energy Plants in Europe
Each year, CEWEP publishes a map of Waste-to-Energy plants in Europe, based on data coming from CEWEP members and national sources.
This overview shows that Waste-to-Energy treatment capacity was overall stable compared to 2020, with a small increase in capacity.
THe overall number of facilities slightly decreased compared to 2020 due to a change in our data collection methodology.

CEWEP EU Map for WTE 2021
The Hard Truth
Even if we do not provide incineration plants to our clients, we must reference incineration as a benchmark. Because it is a globally dominant, well-recognized technology. Incineration is not being dismissed, as some commentators have indicated, but rather the opposite. An extract from the extensive 1000-page plus report “Waste to Energy 2024/2025” by Ecoprog, a reputable consultant known for thorough market analysis, can be downloaded. ecoprog extract link 2024/2025
Ecoprog states: “As of early 2024, there were more than 2,800 WtE plants worldwide, reaching a disposal capacity of about 576 million tons per year. We estimate about 3,100 plants with a capacity of more than 700 million tons to be operational by 2033. This is 600 more increase as predicted from the 2,200 WtE facilities operational around the globe 10 years ago. ” As indicated on page 4 of the extract, ECOPROG only accounts for “9. 2 Thermal treatment: incineration and gasification” technologies. This is due to the fact that other technologies such as pyrolysis and plasma treatment hold a minimal market share.
It is challenging to pitch incineration plants to clients because frequently, public perception is influenced by speculation and misinformation about the market. Nonetheless, what is clear is that we need to evaluate any technology against incineration, as it remains the most validated and widespread technology globally. We cannot draw comparisons between our offerings and questionable pyrolysis manufacturers, whose systems lack a proven history of success.
Thus, when we present any other alternative waste to energy technology mainly aimed at MSW, we consistently compare CAPEX, OPEX, capacity factor, and energy generation with incineration plants of comparable capacity. This approach provides our client with a solid foundation for comprehending the project and technology.
And indeed, incineration continues to evolve and has not yet made its final mark in the global waste-to-energy sector.
The Industry Barometer
2024 was a favourable year for Waste-to-Energy (WtE), according to the yearly Waste-to-Energy Industry Barometer.
The report shows an increase in optimism among WtE plant operators, with the business climate index climbing to 91. 7 points in 2024 from 87. 6 in 2023; this is amidst a challenging economic landscape.
The Barometer also points to an enhancement in plant utilization, with 66% of participants indicating high usage compared to 42% last year.
The results show increasing optimism among WtE plant operators. Gate fees are expected to rise, especially in Germany, where the implementation of a CO₂ levy in January 2024 has heightened expenses for WtE facilities. At the same time, 95% of plant operators assessed their current business situation as “good” or “satisfactory,” underscoring the sector’s durability under escalating pressures.
The report also highlights considerable obstacles to progressing carbon management technologies, including high investment expenses, insufficient regulatory frameworks, and infrastructure issues such as the absence of CO₂ transport pipelines.
While 61% of operators are in discussions about carbon capture initiatives, only 14% have made significant moves towards implementation.
Numerous industry stakeholders consider carbon management crucial for meeting the EU’s net-zero emissions objectives, yet advancement is slow. Operators emphasize the critical need for financial incentives and legal clarity to promote carbon capture and help achieve the EU’s net-zero ambitions.
Globally, Europe continues to be the largest market for WtE technologies, but the emphasis has shifted towards maintaining and modernizing aging infrastructure instead of new developments.
Beyond Europe, market growth is sluggish in areas such as India and Brazil, where insufficient financial incentives, regulatory hurdles, and public perception challenges impede development. In China, a significant drop in WtE projects, influenced by the real estate crisis, has diminished its global impact, although it remains the leading WtE market by capacity.
The Industry Barometer stresses the significance of favorable policies and investments to maintain the sector’s growth. The findings support a comprehensive strategy for waste management, acknowledging the contribution of WtE in meeting environmental objectives while tackling economic and technical challenges.
Reference – https://www.cewep.eu/wp-content/uploads/2024/10/Industry-Barometer-Waste-to-Energy-2024.pdf
Read More